
Marine Chartplotters... Raster vs Vector explained
For reference: A raster chart is a “pure” official (UKHO, Imray, etc.) chart drawn by a professional cartographer and presented in electronic form. A vector chart is a purely digital derivative of the raster chart containing the information in a paper chart, but rendered into an image by a computer on the fly.
This is a safety related article, dealing with the kind of detail available on vector charts as embedded in your cheap or not so cheap chart plotter... and the kind of rich detail that can (and should) be found from other sources. Especially when navigating close to the shore or in shallows.
.
Being the skipper of a small craft brings with it certain responsibilities. The skipper is responsible for the safety of the craft and crew, it is down to the skipper to make sure that he has suitable navigation equipment, up-to-date charts, and makes a passage plan taking into account the weather and tides.
We are assuming that people reading this article know how to use paper charts in the traditional manner. Plotting positions, taking bearings on shore objects for position lines, and making allowances for the tidal streams during their passage. Elementary stuff that should be mastered before putting to sea... Any skipper worth his salt should be able to make a coastal passage without using a GPS at all.
.
Well a GPS set is de-rigeur now, and lately minature chart plotters seem to be the norm. For what they are they are very good but, inevitably, suffer from inaccuracies inherent from their lack of size and the way the "charts" are drawn. There is a reason navigational charts are big... to give the mariner spatial awareness of everything around him.
.
If you buy one of these little dedicated chart plotters (or bigger and more expensive "plumbed in" plotters for that matter), you can be sure of two things:
One: They come with a warning disclaiming their use for navigation.
Two: The charts embedded in them will be vector charts.
By this time the buyer may well be scratching his head and wondering just what has he laid his money out for ?
.
Well I most certainly wouldn't say no to a larger waterproof plotter/display unit at the helm position. With NMEA feeds plumbed in, showing depth, wind, position on vector chart, and maybe even a radar overlay... or AIS. Excellent for quick reference, positioned just where it is needed. There is a use for these products, and sensibly set up used, they can be a useful aid to safety.
The danger lies with the less conscientious of us taking what we see on that little chart plotter screen as being always correct, and relying on it way beyond the bounds of its capability or accuracy. This is not good seamanship, and can lead to dangerous situations developing at a place where boats find themselves most vulnerable... close to the shore.
It is precisely when closing the shore (or crossing shallows) that maximum attention must be paid to chart work. Shore and shallows are regular occurrences for the small craft skipper, and he should arm himself with multiple sources of the best information available.
.
So what is the point of this article, what are you driving at ? If you ever cross shallow or drying waters you need to see these examples below:
The first column shows standard Admiralty raster charts, the second shows the same area in Polar View, but running "Official" S57 vector data, the third column shows another very popular vector chart system.
The views we've chosen are simply places close to us that we know very well. You can expect similar kinds of results elsewhere.
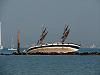
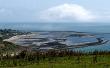
Wootton Rocks, tall ship Marjorie aground ... and Bembridge Ledges.
Local hazards (click thumbnail to see full size images)
.
.
After viewing the chart exapmles in the zoomify viewer, you'll probably end up agreeing with the statement below:
.
"At the UK Hydrographic Office, and many other national Hydrographic Offices, vector data (ENC) is created by tracing over the raster data. The significance of this cannot be overstated . The best quality image possible from this data can only ever approach the original raster image. When the electronic navigation chart (ENC) is displayed, with all possible display options enabled, the total amount of display information will still only approximate to that available from the raster image."
From a white paper by CherSoft, the company who produce "Easy Tide" for the UKHO. They also make a PC chartplotter using Admiralty vector data. They know what they are talking about. For a full understanding of the differences between RASTER and VECTOR charts download the white paper
.
There are reason why vector charts are used in small plotters. Size of the data, ease of handling it, seamless displays, etc. But if you read the white paper, you'll see it's "late rendered" and instead of the skills of a cartographer carefully drawing a chart with exactly the right amount of detail for the given scale... You have a computer deciding what you're going to see (or more importantly not see).
Chart plotters using raster charts are not seamless and more "clunky". But you are looking at an image prepared by a professional.
.
What's our advice here:
Do not totally rely on a chartplotter using vector charts. If you prepare a route on one, examine it carefully at the largest scales available. You may find your route is taking you across a danger you haven't seen at the scale you're using. Be wary of drying heights on vector charts, check with raster charts.
Best of all, with electronic chart prices so low, is to have both raster and vector systems on board. Use your dedicated vector chart plotter in conjunction with an app or laptop using raster charts. Several of our customers do just that.
.
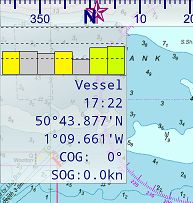
If getting an app and raster charts, make sure you can read your Lat/Lon directly from the screen (for plotting on paper chart if reqd.) Also it's good to have a guide as to how valid your GPS signal is at the time (how accurate). Ease of route planning, ability to add/move waypoints, distances bearings, etc... all useful.
If you use a dedicated onboard plotter, consider getting an Android tablet (bigger the better) and using Marine Navigator and our VMH raster chart set as a backup....
.
"The stars of the show were the oldish Aurohelm 200 tiller pilot and Nexus 7 tablet (free with my phone) with a £4.50 app and admiralty charts from Visitmyharbour.com covering the whole of the UK, simply superb, never missed a beat which is more than can be said for the Garmin which has developed back lighting and contrast issues"
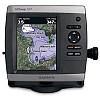
"There is an additional point that could be made: I was aware that my Garmin (the one you illustrate!!) was a few years out of date so, this summer, purchased an update for £50.It turned out to be a blank SD card that I had to go onto the Garmin main site, download the new charts onto the card and then plug it into the chart plotter. It didn’t work and after phone calls and further efforts to download with no more success I eventually sailed with the out of date charts still installed.
The very next day I came out of harbour before dawn and could see a flashing white light in the general direction I intended to go. Couldn’t see the light source on my Garmin – but found it on my Sea Clear – a new NCM which was definitely not in the Garmin. I’ve left the Garmin with the chandlery from which I purchased the update to sort out over the winter!! The point to be made is that updating the chart plotter is far more expensive than sending back your Sea Clear disc and getting a new one.
Also – the second sentence of your advice at the end You may find your route is taking you across a danger you haven't seen at the scale you're using. From my experience I would say you would be justified in saying “ You will often find…………” "
Article Info